
Density Tiers
Every pattern page in this guidebook notes which density tiers it's typical for, using chips like Suburban shown on the How to Read a Pattern page. This page explains what those six tiers mean, where the names and numbers come from, and how to read them.
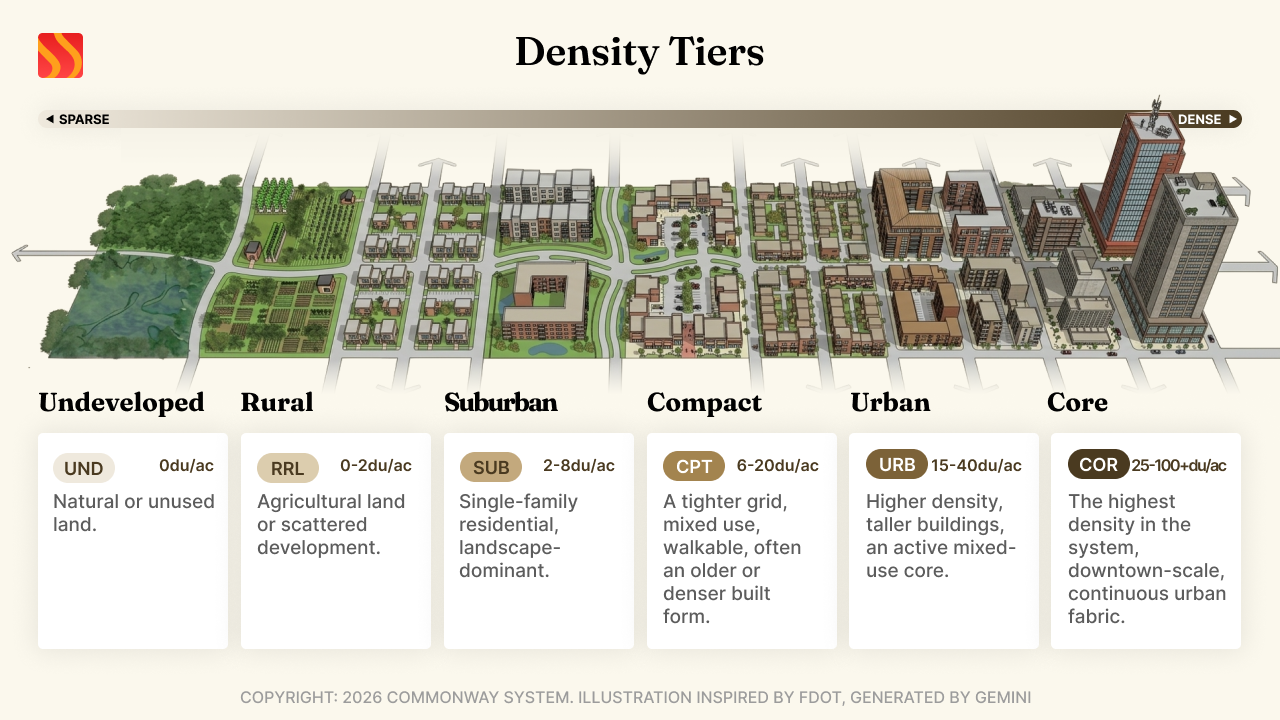
Density here means how much housing and activity sit on the land around a given street, not the street itself. The same Street Typology can look different at different densities, and the tier system exists so the guidebook can say precisely which context it's describing without a paragraph of throat-clearing every time.
#The six tiers
| Tier | Code | ITE/CNU equivalent | What it looks like |
|---|---|---|---|
| Undeveloped | UND | C1 Natural | Natural or unused land. |
| Rural | RRL | C2 Rural | Agricultural land or scattered development. |
| Suburban | SUB | C3 Suburban | Single-family residential, landscape-dominant. |
| Compact | CPT | C4 General Urban | A tighter grid, mixed use, walkable, often an older or denser built form. |
| Urban | URB | C5 Urban Center | Higher density, taller buildings, an active mixed-use core. |
| Core | COR | C6 Urban Core | The highest density in the system, downtown-scale, continuous urban fabric. |
The six-zone structure itself, and the C1-C6 naming, comes from a joint ITE and CNU practice guide.1
#How the numbers work
Each tier also carries an approximate density range, measured in housing units per acre. These numbers are diagnostic, not regulatory: they help a reader place a real segment of street into the right tier, they don't set a zoning cap or a legal limit anywhere in this guidebook.
| Tier | Units per acre |
|---|---|
| Undeveloped | 0 |
| Rural | 0-2 |
| Suburban | 2-8 |
| Compact | 6-20 |
| Urban | 15-40 |
| Core | 25-100+ |
The Suburban through Core figures come directly from the CNU transect methodology this system is adapted from.2 Rural's ceiling is set to match Suburban's floor, keeping all six tiers connected with no gap between them. Within that range, the U.S. Census Bureau's own housing-unit density threshold for what counts as urban at all works out to roughly 0.3 units per acre,3 which lands well inside Rural's range and supports genuinely rural land sitting at the low end of it.
These ranges intentionally overlap between adjacent tiers, the same way the underlying methodology does. Density is a gradient, not a hard cutoff, so a segment sitting in an overlap is genuinely borderline. When that happens, the plain-language description in the table above is the primary way to tell tiers apart; the numeric range is a secondary check, not the deciding factor.
One tier has a firmer numeric anchor than the rest. The Urban-to-Core boundary is also marked by a persons-per-acre or jobs-per-acre threshold, 20 persons per acre or 45 jobs per acre, adapted from a Florida Department of Transportation formula that distinguishes those two tiers specifically.4 It doesn't appear elsewhere in the table on purpose: applying a precise persons-per-acre number to every tier would suggest a level of certainty the underlying sources don't actually support.
#A real-world reference point
Miami's own zoning code is built on the same six-zone transect concept and reaches noticeably higher densities than the ranges above: Suburban 9-18 units per acre, Compact up to 36, Urban up to 65, and Core as high as 150 by right, with bonus-area provisions allowing over 1,000 units per acre in parts of downtown Miami.5 It's included here as a real, adopted example of how high a major US city has actually calibrated these tiers, not as the source the ranges above are built from.
#Why these names
The six tiers, in order, are Undeveloped, Rural, Suburban, Compact, Urban, and Core. One other name was considered and set aside during development: "Streetcar" was an early candidate for the tier that became Compact, but it assumed a streetcar-era origin that doesn't hold for every neighborhood the tier needs to describe, plenty of Compact-tier places never had a streetcar line running through them. Compact does the job without that baked-in assumption: denser and tighter than Suburban, but not yet large enough or continuous enough to count as Urban.
There's no separate tier for a small town. A small town's Main Street often reads as a pocket of Urban or Compact intensity sitting inside an otherwise Rural surrounding area, and that's fine: density tiers are assigned to a specific segment of street, not to an entire town or region, so a single block can carry a different tier than the land around it.
#How this connects to the rest of the guidebook
Every Street Typology page in the guidebook lists which density tiers it's typical for, using the same six tiers and codes described here. A pattern marked typical at Suburban, Compact, and Urban is telling you it shows up as the normal choice in those contexts; a tier marked as an edge case means it happens but isn't the norm; a tier marked unlikely means the pairing rarely occurs in practice. See the Street Typology Pattern Index for the full list.
#References
- Precedent-based Institute of Transportation Engineers and Congress for the New Urbanism, Designing Walkable Urban Thoroughfares: A Context Sensitive Approach, 2010. Available at: https://19january2017snapshot.epa.gov/smartgrowth/designing-walkable-urban-thoroughfares-context-sensitive-approach(opens in new tab)
- Precedent-based Congress for the New Urbanism, "The Transect," Public Square: A CNU Journal, by Robert Steuteville, published June 10, 2009, updated January 22, 2016. Available at: https://www.cnu.org/publicsquare/transect(opens in new tab)
- Legal / regulatory U.S. Census Bureau, "Urban Area Criteria for the 2020 Census, Final Criteria," Federal Register, March 24, 2022. Available at: https://www.federalregister.gov/documents/2022/03/24/2022-06180/urban-area-criteria-for-the-2020-census-final-criteria(opens in new tab)
- Legal / regulatory Florida Department of Transportation, Context Classification Guide, Chapter 2, "Step-by-Step Guide for Determining Context Classification," October 2024. Available at: https://fdotwww.blob.core.windows.net/sitefinity/docs/default-source/roadway/completestreets/files/fdot-context-classification.pdf(opens in new tab)
- Legal / regulatory City of Miami, Miami 21 Code, Article 4, "Standards and Tables," Table 4, "Density, Intensity and Parking," as adopted May 2010. Available at: https://www.miami21.org/PDFs/FinalDocumentsMay2010/FULLDOCUMENT-May2010.pdf(opens in new tab)