
Design Speed & Speed Limits
Why the sign doesn't set the speed
In 2009, Los Angeles moved to raise the speed limit on Zelzah Avenue between Chatsworth and Nordhoff streets from 35 to 40 mph. A city survey had found most drivers already going faster. California tied radar enforcement to that kind of survey, so the transportation department said the limit had to rise.12
A Cal State Northridge student told the campus paper that raising the limit would only encourage more speeding, and that the next survey would push it up again.1
In 2018, after another survey, the city raised the same stretch to 45.23 NACTO notes no design or land-use changes in between. Other factors may have played a part, but the case suggests drivers' speeds drift up to follow the posted limit.2 In 2022, after California gave cities more room, Los Angeles brought it back down to 40.34
The sign kept chasing the drivers. The drivers were following the street. This page is about that gap.
#Three speeds, three deciders
Every street has three speeds, and different people set each one.5
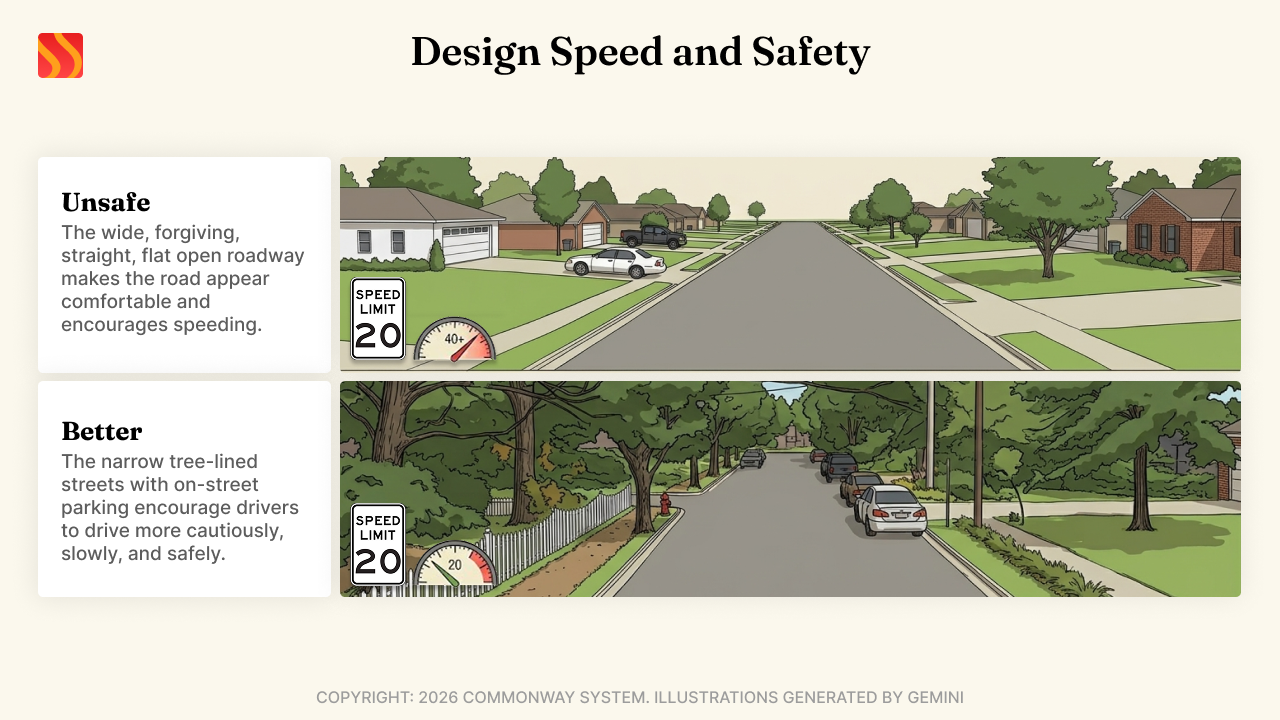
- Design speed is set by engineers. It is a chosen number used to size the road's curves, sight lines, lane widths, and other geometry.67 It appears on the plans, not on a sign.
- Operating speed is set by drivers. Engineers usually measure it as the 85th-percentile speed: the speed that 85 percent of free-flowing drivers go at or below.8
- The posted speed limit is set by a state or local agency. Federal guidance says it should fall within 5 mph of the 85th-percentile speed, and every state agency in one FHWA-cited survey used that measure.9
These three numbers often disagree.5 The strongest link among them runs between how fast people drive and the posted limit. Neither relates to design speed with anywhere near that confidence.10
#Why you should care
- Your neighbors' lives. A person on foot hit at 23 mph has about a 1 in 10 chance of dying. At 32 mph it is 1 in 4; at 42 mph, 1 in 2.11
- Your parents. A 70-year-old hit at 25 mph faces about the same risk of severe injury or death as a 30-year-old hit at 35.11
- Your street. A speed survey can push a street's limit up even when nothing about the street has changed.29
- Your sidewalks and corners. Higher design speeds bring wider lanes, wider turning curves, guardrails, broad clear zones, and lost parking, all of which make a street harder to walk.12
#How it happens
Roads are built for more speed than their design speed. Geometry standards assume near-worst-case conditions, such as slow reaction times, so a road built to them carries more speed in good conditions.89 Designers are also told to exceed the minimums where they can. The result is an inferred design speed, the fastest speed the finished geometry supports, often well above the number on the plans.79
Drivers follow the road, not the plans. People pick a speed from what they see: lane width, curves, sight lines, driveways, parked cars, people walking.91013
Nothing ties the numbers together. A 1985 FHWA memo said design speed should equal or exceed the posted limit. Later FHWA memos softened that, calling the posted limit an operating decision for the road's owner. In 2001, AASHTO's Green Book redefined design speed as simply a number chosen to size the road's geometry, and its guidance on choosing one says nothing about speed limits. In 2015, FHWA stated that no regulation establishes a direct link between them.7
The limit ratchets up. Posted limits are set near the 85th-percentile speed, so when a street invites faster driving, the next survey raises the limit.9 FHWA itself warns that raising limits to match speeds may push speeds higher still, in a cycle of escalation.9 In one FHWA example, a Pennsylvania highway opened at 40 mph and was raised to 50 after a review of actual speeds; both exceeded its design speed.9 NACTO sums up the pattern as higher speeds and higher limits over time.2
#How strong is the evidence
Note
The faster a car is going when it hits someone on foot, the likelier that person dies: about 10 percent at 23 mph, 25 percent at 32 mph, and 50 percent at 42 mph.11 A street's design, more than its sign, sets how fast people drive.910
These figures come from a 2011 AAA Foundation study of U.S. crashes, weighted to correct older studies' habit of oversampling the worst crashes, so they run lower than some widely quoted older estimates. Even so, risk climbs steeply across the speeds most city streets are posted at.11
The design side is less tidy. A federal research project found no reliable link between design speed and operating speed, but found that driveway density, medians, parking, and pedestrian activity did affect how fast people drove.10 FHWA's own guide notes that the design process has no systematic consistency check and is suspected of encouraging speeds above the design speed.9
#Fair questions
Won't drivers just ignore a lower sign? Often, yes. FHWA reports that research has repeatedly found changing the posted limit alone does little to actual speeds.9 Newer studies are more hopeful: after Toronto cut local-street limits from 40 to 30 km/h, pedestrian crashes fell 28 percent and serious and fatal injuries 67 percent, though the drop was not statistically larger than on comparison streets.14 A sign works best when the street agrees with it.
Why not just enforce the limit? Enforcement works near the officer or camera, and the effect fades with distance and time.9 Street design keeps working when no one is watching.2
Isn't the 85th percentile a fair way to set limits? It assumes most drivers choose a reasonable speed, and engineers have relied on it since the 1930s.8 NACTO notes that the research behind it came from rural two-lane highways, not streets where people walk and cross.2 On streets that invite speeding, it feeds the ratchet above.9
Isn't it safe to drive faster than a road's design speed? On many rural highways, often yes. Design criteria include a safety margin, and FHWA says a posted limit above the inferred design speed is not necessarily unsafe.78 On streets, the risk falls mostly on people outside the car, and their odds worsen fast as speed rises.11
Won't slower streets make my trip longer? Usually by little. When Seattle took a mile of Rainier Avenue South from four lanes to three and cut its limit to 25 mph, evening car trips along the corridor took 54 seconds to 1 minute 21 seconds longer, and northbound evening buses got 3 minutes faster.15
#What works
Build the speed into the street. FHWA calls this a self-enforcing road: one designed so drivers choose the intended speed on their own. In that approach, the target speed sets the design speed and becomes the posted limit.13 NACTO's urban street guidance says the same: target speed, design speed, and posted speed should match.12
Example: Rainier Avenue South, Seattle. In 2015, Seattle converted a mile of this four-lane arterial to one lane each way plus a center turn lane, and lowered the limit from 30 to 25 mph to match the project's 25 mph design speed.15 At one count point, the share of northbound drivers speeding fell from 84 to 40 percent, and northbound drivers going over 40 mph fell 81 percent. In the first year, crashes fell 15 percent, injury crashes 30 percent, and crashes involving people walking or biking 40 percent, with no serious-injury crashes against a prior average of 9 a year.15
Let cities set limits for safety. California's AB 43, in 2021, let cities cut an extra 5 mph on their most dangerous streets and where many people walk and bike, and hold a limit steady when a new survey would have raised it.4 Los Angeles then approved 5 mph cuts on about 177 miles of streets; before the law, it had been required to raise limits on 200 miles.3 NACTO's City Limits gives cities a method that sets limits from conflict and activity levels rather than from current driving speeds.2
#What the Commonway System does
Design speed always equals the posted speed limit.
On every Local, Collector, and Arterial pattern in this guidebook, the speed on the sign is the speed the street is built for and the speed people are meant to drive, all at once, by design. It is not a target to work toward. The street's lanes, curves, and sight lines make any faster speed feel wrong to drive.1213
| Classification | Speed rule |
|---|---|
| Local | 20 mph maximum, no exceptions |
| Collector | 30 mph; 35 mph only with rigid, crash-protective bike separation |
| Arterial | 30 to 55 mph by density tier, minus 5 mph for noise or frequent access (see below) |
| Freeway | Left to existing federal and state systems |
#Local: 20 mph, no exceptions
The Stockholm Declaration, agreed at the 2020 global ministerial conference on road safety, calls for a 30 km/h (about 20 mph) maximum where people walking or biking mix often with traffic, except where strong evidence shows a higher speed is safe.16 CS holds Local streets to 20 mph with no exception clause, a stricter rule. A struck pedestrian's risk of severe injury reaches 10 percent at 16 mph, and risk of death reaches 10 percent at 23 mph.11 Local geometry must make 20 mph the comfortable speed, and no Local pattern may be designed to a higher inferred speed. See Default Local Street (LOC-DEF-01).
#Collector: 30 mph, or 35 with rigid separation
CS holds Collectors to 30 mph. It allows 35 mph only where bike facilities have rigid, crash-protective separation, such as a concrete barrier or permanent curb, not flexible posts.
- Seattle's street design manual prefers curb medians where speeds are expected to exceed 30 mph, treats flexible delineators as temporary, and calls for permanent separation where volumes and speeds are higher.17
- FHWA's separated bike lane guide treats delineator posts and rigid barriers as different options, chosen partly by traffic speed, and notes the posts' durability problems.18
- Dutch practice draws the line at the same speed: distributor roads at this speed class call for physical separation between cars and bikes.19
- FHWA's bikeway guide notes that crash and death risk for people walking and biking rise sharply once vehicle speeds pass 25 mph.20
See Default Collector (COL-DEF-01).
#Arterial and Freeway
Arterial speeds start from a density-tier baseline with two possible adjustments, detailed in How Arterial speeds are set below. Freeways (Freeway Default (FRE-DEF-01), Expressway (FRE-EXP-02), Beltway or Ring Road (FRE-BLT-03)) sit outside CS's detailed design scope. AASHTO's Interstate standards and each state DOT's speed-setting authority already govern them, and CS respects that system rather than duplicating it.
#What you can do
When a speed survey proposes raising a limit near you, ask:
- What is this street's design speed, and what speed does its geometry actually support?
- If drivers are going too fast, why change the sign instead of the street?
- Does our state let the city set limits for safety rather than from current speeds?
When a street is repaved or rebuilt, ask whether the new lanes, curves, and crossings will match the posted limit. See How Road Changes Actually Happen for how to raise these at a public meeting.
Related Media
17 items
 Aligned(opens in new tab)
What is the "Correct" Speed Limit?
 Not Just Bikes
Makes the physics and data case for 30 km/h (roughly 20 mph) as the safe default urban speed, the same logic behind CS's own Local street speed cap.
MED-017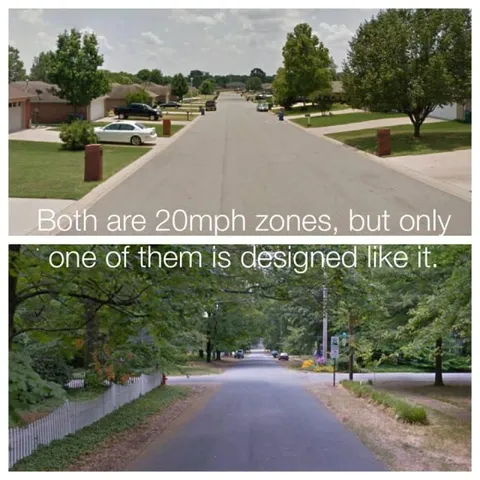 Aligned(opens in new tab)
The Key to Slowing Traffic is Street Design, Not Speed Limits
 Strong Towns
Makes the case, with side-by-side street photos, that a posted number on a sign does not change driver behavior the way lane width, block length, and sightlines do, the same self-enforcing-design principle behind CS's own design-speed-equals-posted-speed rule.
MED-021 Aligned(opens in new tab)
Crossing the Street Shouldn't Be Deadly (but it is)
Not Just BikesThis video walks through pedestrian crossing designs, from beg buttons and signal phases to raised crossings, HAWK beacons, and continuous sidewalks. It shows how crossing geometry and timing decide whether walking is safe, the same question behind the Commonway System's crosswalk and crossing elements.
MED-022 Aligned(opens in new tab)
Three ways to FIX a STOP LIGHT (so drivers ACTUALLY STOP!)
 Road Guy Rob
The video covers practical signal-design fixes that cut red-light running, from better visibility to slower approaches and fewer stops. It is applied evidence for the Commonway System's signal intersection pattern.
MED-029 Aligned(opens in new tab)
A Flaw In Street Design May Be Costing Lives - Cheddar Explains
 Cheddar
The video explains "forgiving design," the wide clear zones built for driver error, and draws the roads-versus-streets distinction. It covers the design-speed thinking at the heart of the Commonway System's street types and design speed guides.
MED-041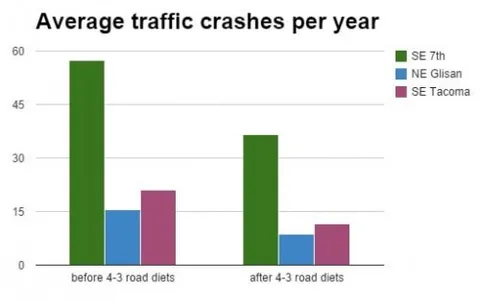 Aligned(opens in new tab)
The Airtight Case for Road Diets
 Streetsblog USA
The article lays out the evidence for four-to-three lane conversions, citing FHWA data showing 20 to 50 percent crash reductions with minimal capacity effects. It is the evidence summary behind the Commonway System's four-to-three road diet retrofit strategy.
MED-047 Aligned(opens in new tab)
20mph speed limits do save lives, and most road users respond to them well, study suggests
BBC Science FocusThe article reports on a study of Edinburgh and Belfast showing citywide 20 mph limits cut road deaths by nearly a quarter and serious injuries by a third. It backs the Commonway System's signature 20 mph maximum on local streets.
MED-053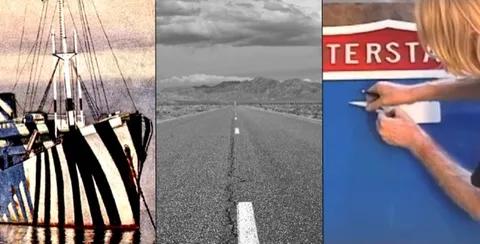 Aligned(opens in new tab)
Trompe L'oeil (Episode 599)
 99% Invisible
The episode's "Built for Speed" segment shows how highway design language, wide lanes and forgiving geometry, tricks drivers into speeding, especially when grafted onto suburban arterials. It illustrates the design-speed thinking behind the Commonway System's street types and stroad analysis.
MED-060 Aligned(opens in new tab)
Ep 3: Beth Osborne - Failures of the Federal Transportation Program
 High Frequency
Beth Osborne explains why the federal transportation program keeps failing, from highways prioritized over maintenance to speed-based metrics that ignore safety. It frames the policy backdrop for the Commonway System's design-speed-equals-posted-speed rule.
MED-061 Aligned(opens in new tab)
How Do We Design for Drivers?
The Strong Towns PodcastGuests from Happy Cities and Mobycon argue that people-centered places still have to work for drivers, borrowing the Dutch idea that slower can be faster when trips feel steady and predictable. It offers a distinct angle on the design-speed philosophy behind the Commonway System's street patterns.
MED-071![The Wrong Way to Set Speed Limits [ST06]](/media-assets/thumbs/med-076-480.webp) Aligned(opens in new tab)
Aligned(opens in new tab)The Wrong Way to Set Speed Limits [ST06]
Not Just BikesThe video explains how speed limits are actually decided in North America, covering the 85th percentile technique, where it makes sense and where it does not, and how to make drivers slow down. It answers the "how does a change like this get decided" question at the heart of the Commonway System's process method, with speed-limit changes as a named example.
MED-076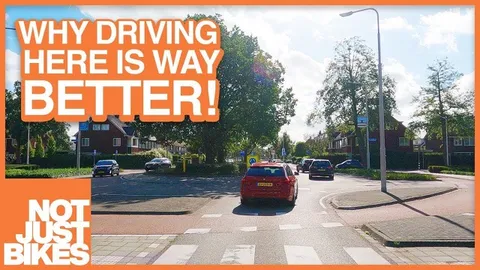 Aligned(opens in new tab)
The Best Country in the World for Drivers
Not Just BikesJason Slaughter argues the Netherlands is the best country for drivers because every road has a single clear purpose, with motorways, distributors, and access streets each designed for exactly one job. It is a working demonstration of the functional classification thinking behind the Commonway System's street types, and of why design speed should follow the road's job rather than habit.
MED-093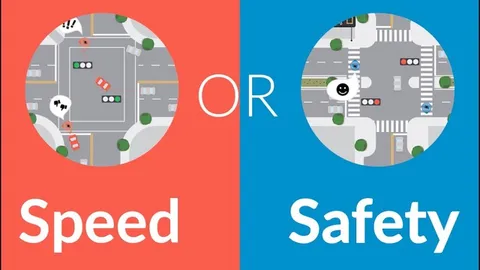 Aligned(opens in new tab)
Why safety and vehicle speed are incompatible goals for street design
 Smart Growth America
This Smart Growth America video argues that transportation agencies must pick one top priority for each street, speed or safety, and shows how the design changes when safety wins. It states the core tension behind the Commonway System's design speed rule: a street's geometry decides its speed, so the priority has to be chosen before the cross-section is drawn.
MED-095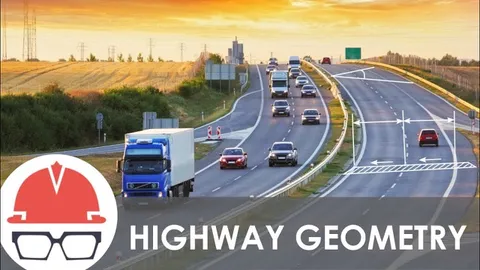 Aligned(opens in new tab)
How Are Highways Designed?
 Practical Engineering
Grady Hillhouse explains how highway geometry, from curves to superelevation, sets the speed drivers actually travel, making design speed a physical property of the road rather than a number on a sign. It is the engineering basis for the Commonway System's rule that design speed always equals posted speed.
MED-096 Aligned(opens in new tab)
America's deadliest road, explained
 Vox
VoxVox examines a one-kilometer stretch of US-19 in Florida, the deadliest of 60 pedestrian-fatality hotspots in a national study, and shows how eight lanes, 45 mph speeds and crossings nearly a kilometer apart make deaths predictable rather than accidental. It is a vivid case study of the Stroad problem and of the crosswalk, signal, driveway and lane-removal fixes the Commonway System specifies.
MED-107 Aligned(opens in new tab)
Dutch Countryside Cycling is the Best in the World: 5 Reasons Why
 On 3 Wheels
Where Dutch rural roads meet villages, the roadway narrows, gains a raised speed table, and switches to block paving, physical cues that tell drivers the road's character has changed. These village entrances are working examples of the Rural-to-Town Gateway pattern, which uses the same deliberate design language to mark the transition from rural road to town street.
MED-110 Context only(opens in new tab)
Are some yellow lights TOO SHORT? (Math to check it!)
Road Guy RobThe video works through the math behind yellow and all-red signal timing, including the dilemma zone. It grounds the Commonway System's signal intersection pattern in the timing details that make signals safe.
MED-031
#How Arterial speeds are set
No existing framework sets Arterial design speed the way CS needs, so this is original CS synthesis, built from FHWA's density principle, NACTO's speed guidance, Dutch noise policy, and Virginia's access-spacing logic. Every piece is cited.
Baseline by density tier. FHWA guidance holds that a rural highway warrants a higher design speed than an urban one, and that for roads other than freeways and major arterials, design speed should typically fall as land use density rises.21 NACTO goes further for urban streets, arterials included: design at or below the target speed, and keep higher speeds for limited-access freeways and highways.12 Its maximum target speed for urban arterials is 35 mph.12 NACTO's guide is written for city streets, so CS applies that cap to its Urban and Core tiers and sets higher baselines for the lower-density Suburban and Compact tiers. CS's six Density Tiers give the principle a structured baseline:
| Density Tier | Baseline Arterial Speed |
|---|---|
| Undeveloped / Rural | 55 mph |
| Suburban | 45 mph |
| Compact | 40 mph |
| Urban | 35 mph |
| Core | 30 mph |
Core's baseline meets Collector's ceiling by design. In CS's densest tier, an Arterial's surroundings are closer to a Collector's than to a rural Arterial's, even though it still carries through traffic.
Noise modifier: minus 5 mph. Where an Arterial segment runs within the noise zone (defined below) of homes, schools, or healthcare, subtract 5 mph from the baseline. Both sides of the Atlantic treat lower speed as a noise tool. Until 2024, the Dutch Noise Abatement Act (Wet geluidhinder) set road-noise limits and required abatement where they were exceeded.22 The N325 Pleyroute in Arnhem is reported to carry its 80 km/h limit for environmental and noise reasons.23 In the U.S., 23 CFR 772, the federal noise rule behind every state DOT's noise policy, lists modified speed limits among the traffic management measures eligible for noise abatement.24 AASHTO's environmental guidance adds that a speed cut of about 20 mph is needed for a readily noticeable drop in noise.25 CS's 5 mph step is smaller because it is one of two contributing modifiers, not a standalone noise fix.
Noise-sensitive adjacency is a distance, set the Dutch way. Until 2024, Article 74 of the Dutch act gave every road a noise zone on each side, measured from the road's centerline and sized by lane count and by urban or rural setting:22
| Lanes | Urban zone | Rural zone |
|---|---|---|
| 1-2 | 660 ft (200 m) | 820 ft (250 m) |
| 3-4 | 1,150 ft (350 m) | 1,310 ft (400 m) |
| 5+ | 1,150 ft (350 m) | 1,970 ft (600 m) |
A noise-sensitive use inside the zone qualifies for the modifier; one outside it does not. Roads posted at 30 km/h and woonerven had no zone at all.22 CS follows the same logic in limiting this modifier to Arterials. CS adopts the table directly, converted to feet, measured from the Arterial's centerline, and keyed to the segment's own lane count.
FHWA's approach is not a distance rule. Under 23 CFR 772, agencies model predicted noise at specific receptor points with FHWA's Traffic Noise Model, and abatement is considered only when a receptor's predicted level approaches or exceeds the federal Noise Abatement Criteria.24 That is a case-by-case standard that needs an acoustic model for each project, not a rule someone can check with a tape measure.
CS takes the Dutch rule over the federal standard on purpose. The law-and-economics literature frames the tradeoff this way: rules cost more to write, but standards cost more for people to interpret before acting and for officials to apply afterward, so rules win when the same question comes up often.26 Guidance on drafting local noise ordinances reaches a similar view: numeric ordinances give objective, predictable standards, while vague ones invite uneven enforcement.27 Rules are also cheaper to enforce, because applying them doesn't require case-specific facts, though the same study argues that where enforcement is thin, a standard's vagueness can sometimes raise compliance.28 A pattern book meant to be used without an acoustic study for every Arterial segment fits the case for a rule: it gives the same answer every time.
Access modifier: minus 5 mph. Where an Arterial segment has three or more crossing points per quarter mile (intersecting streets, driveways, or curb cuts; on average, one every 440 feet or closer), subtract 5 mph from the baseline. That is NACTO's line for a high density of crossing points, one of the inputs to its speed-limit matrix.2 Crash risk rises with access density: research summarized for the National Cooperative Highway Research Program found each added access point per mile raised a road's crash rate about 4 percent.29 The modifier also inverts the Virginia Department of Transportation's logic, which requires wider spacing between intersections and entrances at higher speed limits.30 CS reads the relationship in reverse: tight spacing is itself evidence the speed should come down.
The two modifiers do not stack. If a segment qualifies for both, only the larger reduction applies. This follows how three fields handle overlapping risk factors:
- NACTO's City Limits sets urban speeds from a matrix of conflict density and activity level, not by adding scores together.2
- FHWA treats design speed as one of a small set of controlling design criteria, with each departure justified through its own documented design exception.31
- FHWA's crash modification guidance warns that unless countermeasures act fully independently, multiplying their effects likely overstates the combined benefit.32 Texas DOT's safety manual caps combinations at three for that reason, and names the fix for overlapping factors: the dominant effect method, which applies only the single most effective factor and is the simplest, most conservative approach.33
CS's noise and access modifiers are not independent. Both stand in for the same thing: how much a road's surroundings, not its through-traffic job, should pull its speed down. Applying only the larger follows the same conservative logic safety practice already uses.
Floor: 30 mph. The result never drops below 30 mph except through a documented exception, the same default-plus-documented-exception structure CS uses for roundabout-first intersection control and its crash-investigation process. Because Core's baseline is already 30 mph, a Core Arterial that qualifies for either modifier needs a documented exception to go lower.
#References
- Precedent-based "Zelzah's Speed Limits Face Possible Changes." Daily Sundial (California State University, Northridge), 2009.(opens in new tab)
- Precedent-based National Association of City Transportation Officials. City Limits: Setting Safe Speed Limits on Urban Streets. New York: NACTO, 2020.(opens in new tab)
- Precedent-based "LA City Council Approves Speed Reductions of 5 MPH to More than 177 Miles of Surface Streets." CBS Los Angeles, February 23, 2022.(opens in new tab)
- Legal / regulatory California State Assembly, Committee on Transportation. Bill analysis, AB 1014 (Rogers), April 21, 2025, describing AB 43 (Friedman), Chapter 690, Statutes of 2021.(opens in new tab)
- Legal / regulatory Toole, Joseph S. Foreword to Speed Concepts: Informational Guide, by Eric T. Donnell et al. FHWA-SA-10-001. Washington, DC: Federal Highway Administration, 2009.(opens in new tab)
- Legal / regulatory ⚠ American Association of State Highway and Transportation Officials. A Policy on Geometric Design of Highways and Streets. 7th ed. Washington, DC: AASHTO, 2018.(opens in new tab) Definition verified through FHWA's 2015 memo (ref. 7); the Green Book itself is paywalled and was not read.
- Legal / regulatory Everett, Thomas D. "INFORMATION: Relationship between Design Speed and Posted Speed." Memorandum. Federal Highway Administration, October 7, 2015.(opens in new tab)
- Evidence-based Fitzpatrick, Kay, Joseph D. Blaschke, C. Brian Shamburger, Raymond A. Krammes, and Daniel B. Fambro. Compatibility of Design Speed, Operating Speed, and Posted Speed. FHWA/TX-95/1465-2F. College Station: Texas Transportation Institute, 1995.(opens in new tab)
- Legal / regulatory Donnell, Eric T., et al. "Chapter 6: Government Roles Related to Traffic Speeds." In Speed Concepts: Informational Guide. FHWA-SA-10-001. Federal Highway Administration, 2009.(opens in new tab)
- Evidence-based Federal Highway Administration. "Design Speed, Operating Speed, and Posted Speed Relationships." Summary of NCHRP Project 15-18 (NCHRP Report 504).(opens in new tab)
- Evidence-based Tefft, Brian C. Impact Speed and a Pedestrian's Risk of Severe Injury or Death. Washington, DC: AAA Foundation for Traffic Safety, 2011.(opens in new tab)
- Precedent-based National Association of City Transportation Officials. "Design Speed." In Urban Street Design Guide. Washington, DC: Island Press, 2013.(opens in new tab)
- Legal / regulatory Donnell, Eric T., Kristin Kersavage, and Lisa Fontana Tierney. Self-Enforcing Roadways: A Guidance Report. FHWA-HRT-17-098. Federal Highway Administration, 2018.(opens in new tab)
- Evidence-based Fridman, Liraz, et al. "Effect of Reducing the Posted Speed Limit to 30 km per Hour on Pedestrian Motor Vehicle Collisions in Toronto, Canada: A Quasi Experimental, Pre-Post Study." BMC Public Health 20 (2020): 56.(opens in new tab)
- Evidence-based Seattle Department of Transportation. Rainier Avenue South Pilot Project Evaluation. Seattle: SDOT, February 2017.(opens in new tab)
- Precedent-based Third Global Ministerial Conference on Road Safety. Stockholm Declaration. Stockholm, February 19-20, 2020.(opens in new tab)
- Precedent-based Seattle Department of Transportation. "Protected Bike Lanes." In Streets Illustrated: Seattle Right-of-Way Improvements Manual. Updated January 9, 2017.(opens in new tab)
- Legal / regulatory Federal Highway Administration. Separated Bike Lane Planning and Design Guide. FHWA-HEP-15-025. Washington, DC: FHWA, 2015.(opens in new tab)
- Precedent-based ⚠ CROW. Design Manual for Bicycle Traffic. Ede, Netherlands: CROW.(opens in new tab) Paywalled and not read; claim supported by secondary summaries of Dutch practice.
- Evidence-based Schultheiss, Bill, Dan Goodman, Lauren Blackburn, Adam Wood, Dan Reed, and Mary Elbech. Bikeway Selection Guide. FHWA-SA-18-077. Federal Highway Administration, 2019.(opens in new tab)
- Legal / regulatory Federal Highway Administration. "Design Speed." From Flexibility in Highway Design, 56-59. Washington, DC: FHWA, 1997.(opens in new tab)
- Legal / regulatory Netherlands. Wet geluidhinder [Noise Abatement Act], esp. art. 74 (version valid May 1, 2017, to December 31, 2023). Repealed January 1, 2024, by the Omgevingswet.(opens in new tab)
- Precedent-based ⚠ "Provincial Road N325 (Netherlands)." Wikipedia.(opens in new tab) The article's noise rationale is unsourced, and no Gelderland source confirming it was found; the province treats 80 km/h as the standard limit for this road type.
- Legal / regulatory Procedures for Abatement of Highway Traffic Noise and Construction Noise. 23 C.F.R. pt. 772 (2026).(opens in new tab)
- Precedent-based AASHTO Center for Environmental Excellence. "Noise Overview."(opens in new tab)
- Evidence-based Kaplow, Louis. "Rules Versus Standards: An Economic Analysis." Duke Law Journal 42, no. 3 (1992): 557-629.(opens in new tab)
- Evidence-based FindLaw Attorney Writers. "Guidelines for Drafting Municipal Noise Control Ordinances." FindLaw, updated January 30, 2018.(opens in new tab)
- Evidence-based Gilbert, Michael D., and Nicholas Almendares. "Enforcement and Learning Under Rules and Standards." Legal Theory 32 (2026): e6.(opens in new tab) https://doi.org/10.1017/S1352325226100901(opens in new tab).
- Evidence-based National Academies of Sciences, Engineering, and Medicine. Guide for the Analysis of Multimodal Corridor Access Management. NCHRP Research Report 900. Washington, DC: The National Academies Press, 2018.(opens in new tab)
- Precedent-based ⚠ Virginia Department of Transportation. Road Design Manual, Appendix F, "Access Management Design Standards for Entrances and Intersections," Table 2-2.(opens in new tab) Verified through Virginia Transportation Research Council reporting; the VDOT page blocks automated reading.
- Legal / regulatory Federal Highway Administration. "Revision of Thirteen Controlling Criteria for Design; and Documentation of Design Exceptions." Memorandum, May 5, 2016.(opens in new tab)
- Evidence-based FHWA Crash Modification Factors Clearinghouse. "Frequently Asked Questions."(opens in new tab)
- Evidence-based Texas Department of Transportation. "5.4 Crash Modification Factors (CMFs)." In Traffic and Safety Analysis Procedures Manual.(opens in new tab)